US Life Sciences Transactions 2021
July-September | April-June | January-March
Below are charts summarizing the number of US Life Sciences transactions compiled from Pitchbook* from January to June of 2021, as well as our assessment of the activity in the sector. Each quarter, the Mintz Life Sciences team will update the data to include a new quarter of transactions data and analysis. As the data set builds, we will provide insights gleaned from a review of the data and our experience in the industry.
July-September 2021
Below is a chart summarizing the number of US Life Sciences transactions compiled from Pitchbook* from July to September of 2021, as well as our assessment of the activity in the sector.
Each quarter, the Mintz Life Sciences team will update the data to include a new quarter of transactions data and analysis. As the data set builds, we will provide insights gleaned from a review of the data and our experience in the industry.

3rd Quarter Shows Slower Activity in the Life Sciences
In the 3rd quarter, merger & acquisition activity in the life sciences industry slowed down from the previous quarter, decreasing by a total of 29 transactions, returning to more historically normative numbers than those seen in the 2nd quarter.
IPOs entered the 3rd quarter strong, coming off of a particularly high June deal count, but a significant drop into August and September saw the total 3rd quarter deal count finish below the 2nd quarter, while remaining above 1st quarter numbers.
Venture capital transactions in the life sciences industry experienced a downturn from the 2nd quarter to the 3rd quarter, from a total of 492 in the 2nd quarter to 371 life science venture capital financings in the 3rd quarter. Deal volume was fairly stable across the three months with August 130 deals and both July and September deal counts at 120.
Similarly, the number of life sciences secondary offerings continued its downward trajectory from the previous quarter. The total number of deals decreased by 19 from the previous quarter, with only 2 deals per month in August and September.
PIPE transactions continued the trend of returning to early 2021 deal counts. After experiencing high growth in the 1st and 2nd quarters. The total number of deals fell by 43 between the 2nd and 3rd quarter, with August having the highest monthly activity of 11 transactions.
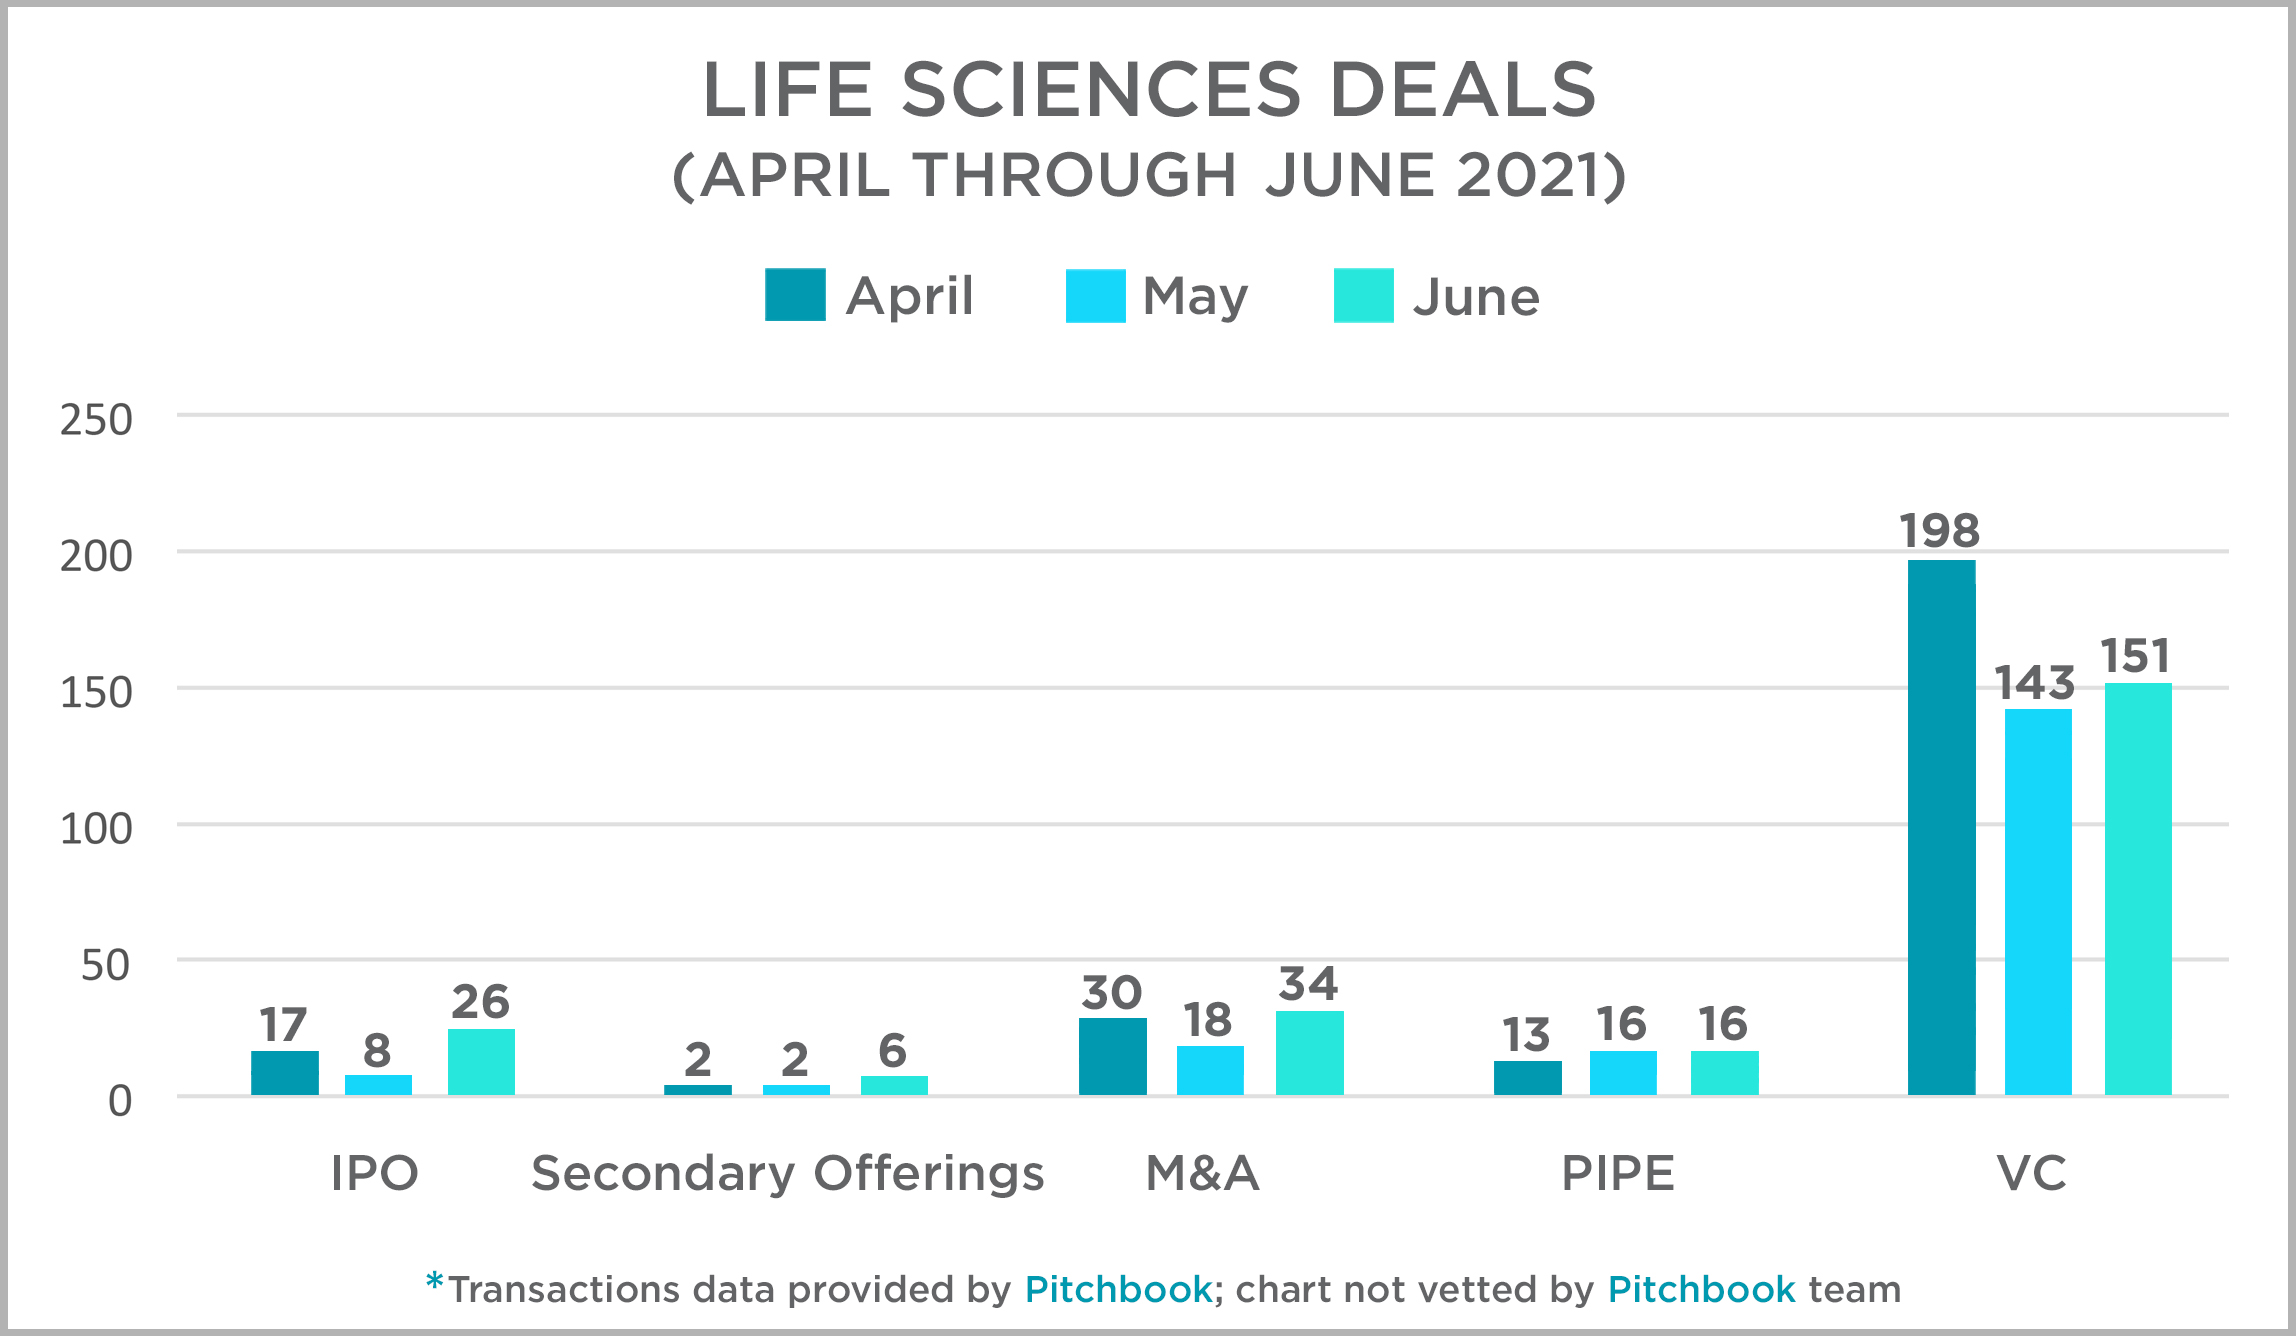
2nd Quarter Shows Substantial Growth in the Life Sciences
In this 2nd quarter, merger & acquisition activity in the life sciences industry was relatively high across the board. April and June both saw over 30 life sciences mergers and acquisitions – representing substantial increases from the same months last year. Nevertheless, May 2021 saw a slight dip in the number of life sciences mergers and acquisitions, with only 18 transactions total – less than half the number of transactions seen in May 2020.
IPOs in the life sciences industry also proved relatively robust in the 2nd quarter. In April 2021, the number of life sciences IPOs reached 17 – a stark comparison with the 3 life sciences IPOs of April 2020. May 2021 maintained the same number of life sciences IPOs as February 2020, and June 2021 had 26 total life sciences IPOs – 8 more than the previous year.
Nevertheless, the number of life sciences secondary offerings proved quite low in the 2nd quarter. Whereas the 2nd quarter of 2020 saw 22 total secondary offerings in the life sciences industry, the same quarter this year saw a mere 10. Most notably, while 17 secondary offerings took place last May, the same month this year contained only 2 such transactions.
Venture capital kicked off the 2nd quarter with a significant number of deals in the life sciences industry. In April, early stage VC deals represented the largest amount of activity with over 62 transactions. Late stage VC activity surpassed early stage VC later in the quarter with 60 late stage deals in June, compared to 42 early stage VC deals during the same month. At its peak in April, overall VC activity fell 7 deals short of last year’s 2nd quarter benchmark of 205. Monthly activity trends also reversed: May 2020 saw the largest amount of VC activity, while May 2021 observed the lowest VC deal flow.
PIPE transactions remained healthy during the 2nd quarter, with an increase in the number of deals year-on-year in April, May, and June. The total number of PIPE deals rose by 64% from last year’s 2nd quarter total.
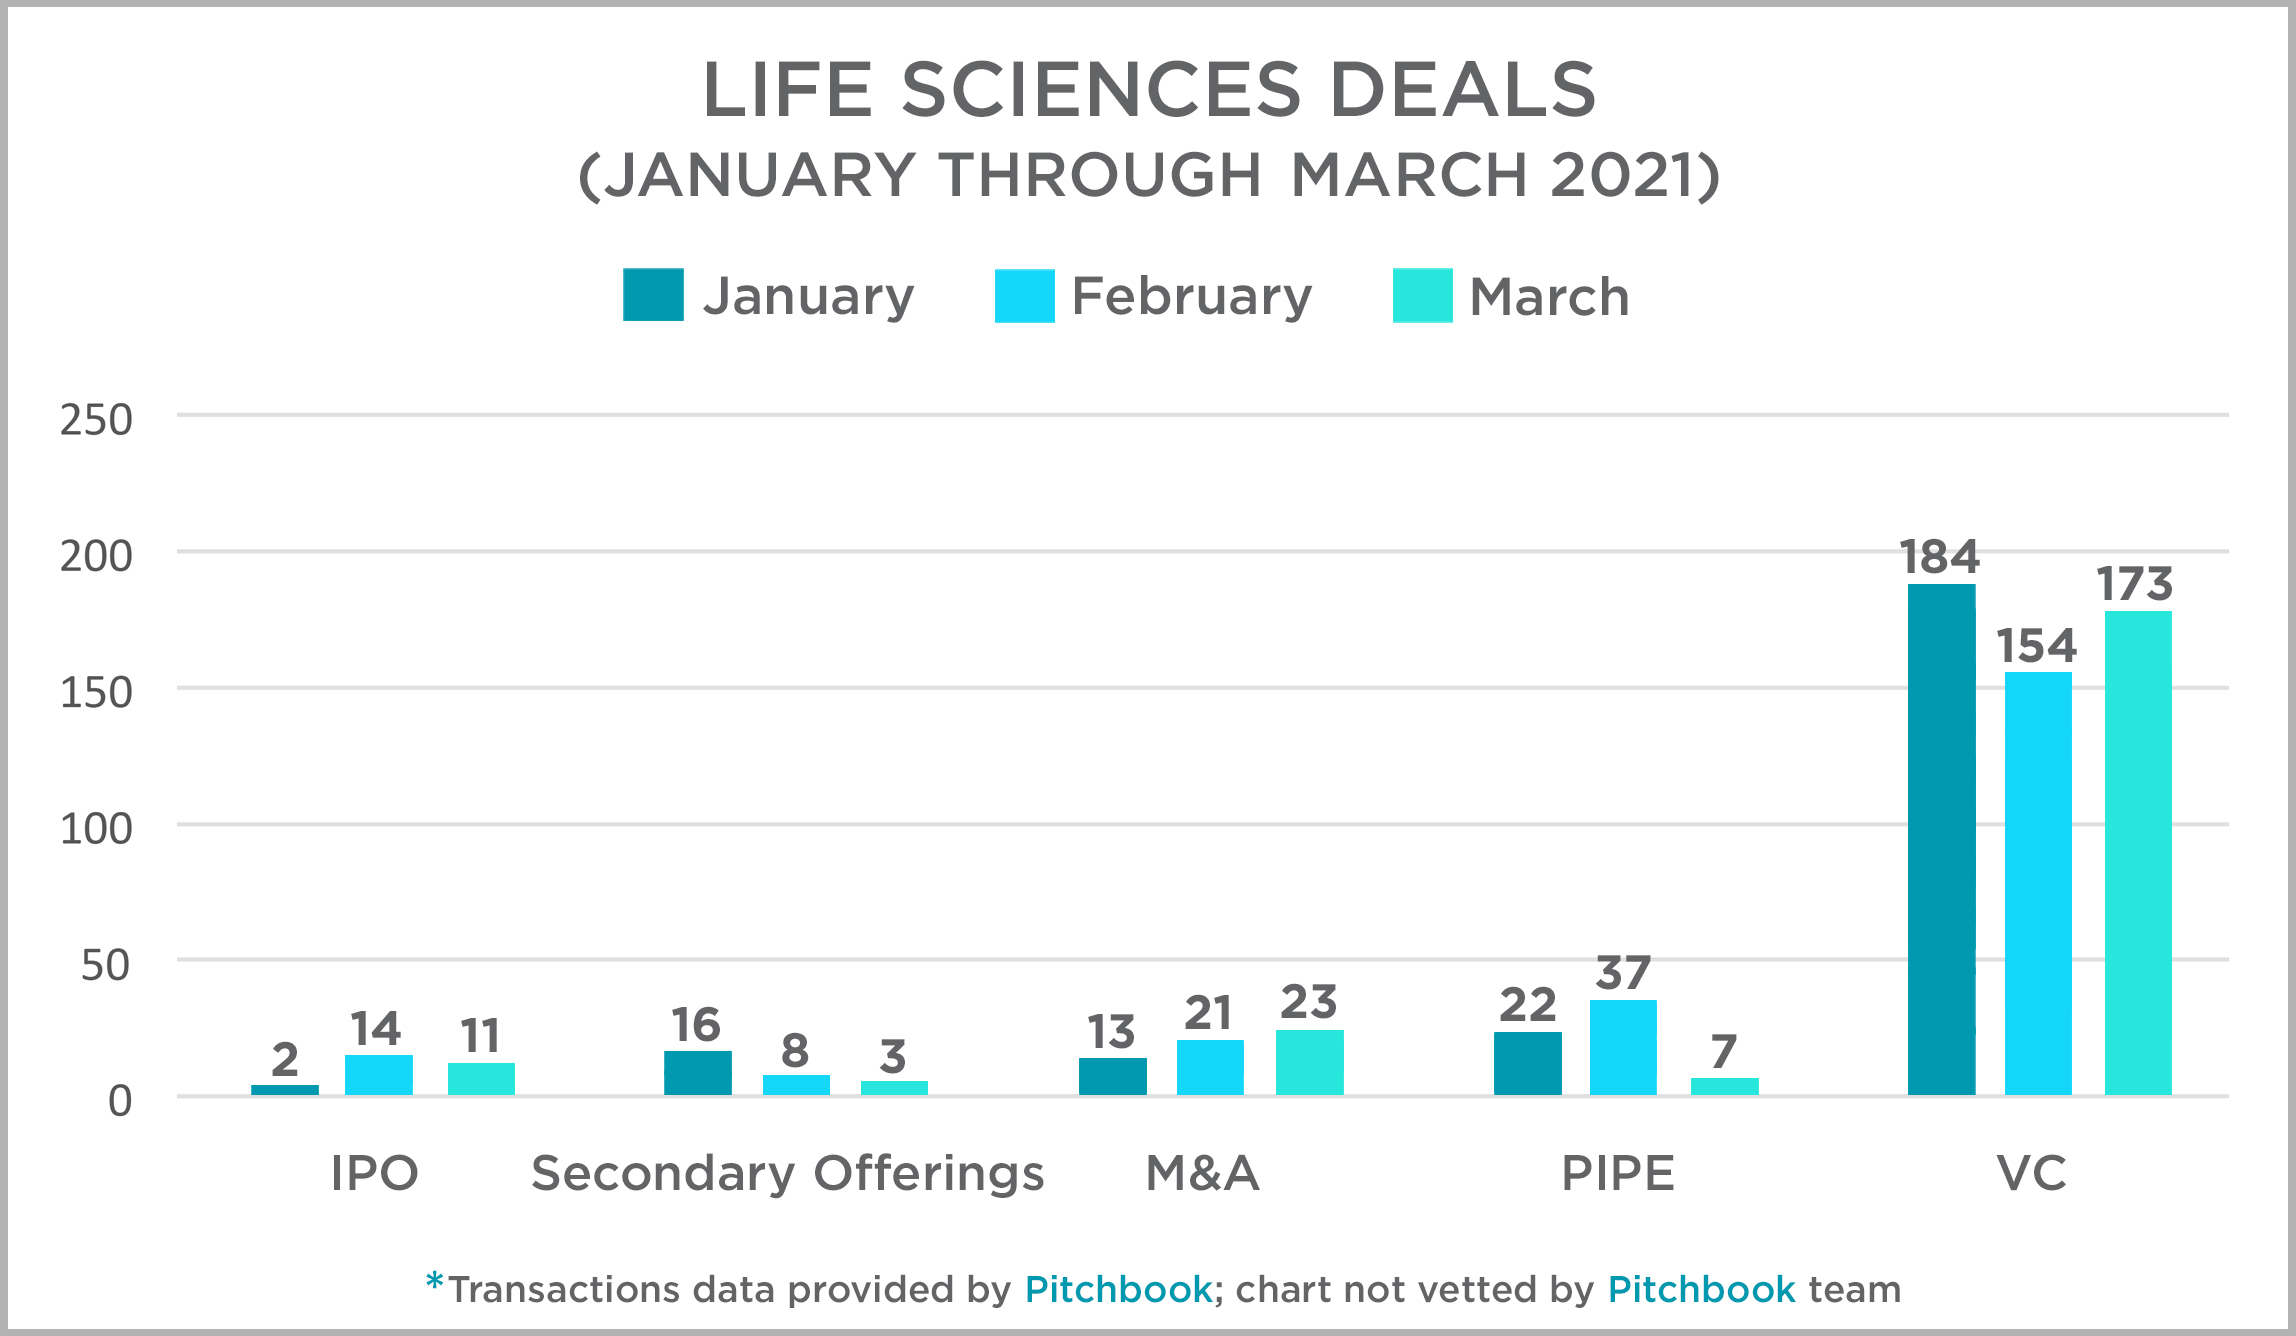
1st Quarter Shows Steady and Promising Growth in the Life Sciences
In the 1st quarter, merger & acquisition activity in the life sciences industry demonstrated stable growth. The total number of deals slightly increased from 57 in last year’s third quarter to 58 this quarter. Mid-quarter deals rose, as February 2021 saw an increase in the number of life sciences mergers and acquisitions, with 21 transactions total–around half the number of transactions seen in November 2020.
IPOs in the life sciences industry also remained steady in the 1st quarter of 2021. In 2021, the total number of life sciences IPOs reached 27 – a slight dip from the 30 life sciences IPOs of the 3rd quarter of 2020. Mid quarter achieved a stronger growth than the previous quarter with an increase of 12 IPOs, while the beginning and end of the 1st quarter of 2021 saw a dip in numbers.
Despite overall growth, the number of life sciences secondary offerings observed a downward trajectory in the 1st quarter. The total number of deals increased by only 2 from the 3rd quarter of 2020. However, the general trend of the 1st quarter saw a continual dip in numbers from 16 secondary offerings in January, to 8 in February, to 2 in March.
In contrast, venture capital activity in the life sciences proved robust the 1st quarter. Activity varied month to month, with the highest in January and the lowest deal flow in February, whereas March picked back up with 19 more deals. Overall VC activity increased by 21% from the previous quarter. This growth can be attributed to later stage VC activity, which rose by 35% this quarter.
PIPE transactions also observed stark growth during the 1st quarter, with an increase in the number of deals by 83% from the previous quarter. February represented the largest PIPE activity in the quarter.